 |
||||||||||||||||||||||
 |
||
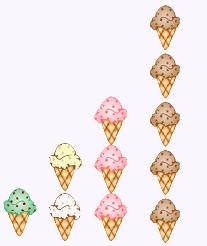
Let's take a look at some new data from a survey on people's favourite ice cream cone flavours. Here's a picture graph showing the data. |
||
 |
||||||||
 |
||||||||
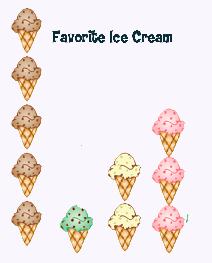
OH NO! Did you notice that the data was not organized in a nice, neat manner? In other words, from least to greatest? |
||||||||
Here we go…flavours in order from least favourite to most favourite. |
||||||||
Step 1: Always re-organize the data into an order from least-to-greatest. |
||
 |
||||
Step 2: Using one-to-one correspondence, begin matching up the data from the ends and moving toward the middle (or, 'fold' the data in half). |
||||
Step 3: The data left in the middle is the MEDIAN.
|
||||
 |
||||
Definition of Median In a set of data the value that is in the middle is the median
|
||||
Why might knowing the median be useful average? Who would use the median for their data? |
||
©2011–2076 Sherry Skipper Spurgeon. All rights reserved. |
||