 |
||||||||||||||||||||||
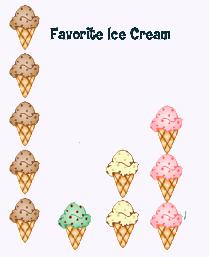
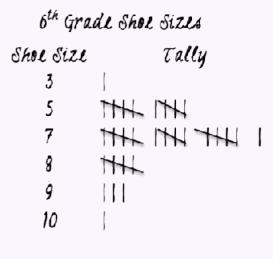
In middle school statistics we learn about three types of averages: mean, median, and mode. Each type of average has its uses. The mode is probably the easiest one to compute, particularly if you have a visual representation like a tally or picture graph. Let's take a look at two sets of data. |
||
 |
||||
 |
||||
Step 1: Put your data in order from least-to-greatest. The shoe sizes data is in order but, the ice cream data is not. Fortunately, for the mode, it is not necessary… |
||
Step 2: Look for the data that occurs MOST often.
|
||
 |
||||
Definition of Mode In a set of data the value that occurs most often is the mode
|
||||
Why might knowing the mode be useful average? How would certain industries use mode? |
||
©2011–2017 Sherry Skipper Spurgeon. All rights reserved. |
||